What is Zabbix monitoring?
Zabbix is an enterprise-class open source distributed monitoring solution.
Zabbix is software that monitors numerous parameters of a network and the health and integrity of servers. Zabbix uses a flexible notification mechanism that allows users to configure e-mail based alerts for virtually any event. This allows a fast reaction to server problems. Zabbix offers excellent reporting and data visualization features based on the stored data. This makes Zabbix ideal for capacity planning.
Zabbix supports both polling and trapping. All Zabbix reports and statistics, as well as configuration parameters, are accessed through a web-based frontend. A web-based frontend ensures that the status of your network and the health of your servers can be assessed from any location. Properly configured, Zabbix can play an important role in monitoring IT infrastructure. This is equally true for small organizations with a few servers and for large companies with a multitude of servers.
Excerpt from: https://www.zabbix.com/documentation/3.2/manual/introduction/about
Package & version considerations
This guide is based on the latest LTS release of Ubuntu, and the latest released version of Zabbix.
Versions used in this installation:
- Ubuntu server 16.04.2 (Xenial), running kernel 4.4.0-62-generic
this was installed through the VMware Player fast installer, which should be about the same as installing with the defaults. - Zabbix 3.2-1+xenial
- MySQL 5.7.18, which nowadays is MariaDB 10.0.29-0ubuntu0.16.04.1
- PHP 7.0, php7.0-common is version 7.0.18-0ubuntu0.16.04.1 as are most other packages
Installing the repository & packages
You can skip this step, which will keep Zabbix updated from your OS distribution’s own repositories, which are usually more stable. Or you add the Zabbix repositories, making sure you’re running a newer version of Zabbix. The later is more an advanced user thing.
We need to add the Zabbix repositories to the list of repositories used by apt-get. On my fresh installation, I was missing dpkg for some reason, which we’ll need to install as well.
sudo apt-get install dpkg
wget http://repo.zabbix.com/zabbix/3.2/ubuntu/pool/main/z/zabbix-release/zabbix-release_3.2-1+xenial_all.deb
sudo dpkg -i zabbix-release_3.2-1+xenial_all.deb
sudo apt-get update
rm zabbix-release_3.2-1+xenial_all.deb
The following command will install all necessary packages and dependencies:
sudo apt-get install zabbix-server-mysql zabbix-frontend-php php-bcmath php-mbstring php-xml
This should proceed without any interruptions or questions till its done.
Database setup
Login to the database:
sudo mysql -uroot
The now installed mariadb uses an empty password login, only available from the root account. Running mysql_secure_installation allows you to set a password, but as root authentication is also using ‘unix_socket’, any password you set will be ignored. If you want to get rid of this:
#OPTIONAL, while in mysql:
update mysql.user set plugin = ‘’ where user = ‘root’;
Consider running mysql_secure_installation after this to set the password and secure access.
Now onto creating the database user and database. Remember to change the ‘password’ to whatever you want for the Zabbix database user:
create database Zabbix character set utf8 collate utf8_bin;
grant all privileges on Zabbix.* to zabbix@localhost identified by  ‘password’;
quit;
Now to import the schema and starting data:
zcat /usr/share/doc/Zabbix-server-mysql/create.sql.gz | mysql -D zabbix -u zabbix -ppassword
Service setup
Now add Zabbix to the startup services, and start the service. As Ubuntu now uses systemd and not upstart anymore, we need to do this through the systemctl command, not update-rc.d:
systemctl enable zabbix-server
systemctl start zabbix-server
Optional: If you wish to add the Zabbix agent to your Zabbix server, run the following:
sudo apt-get install Zabbix-agent
systemctl enable Zabbix-agent
systemctl start Zabbix-agent
This can be handy as Zabbix-server can’t monitor its own server without the agent, only Zabbix specific values can be monitored, which for example won’t show the amount of network traffic or a partition almost out of space.
Now we must change some values in the supplied Apache configuration file. Mainly uncomment ‘date.timezone’ (remove the leading #), and set the correct timezone. The configuration file I edited had two commented out date.timezone lines, one for PHP5 and one for PHP7. Be sure to edit the correct one, or possibly both. In my case this meant changing “# php_value date.timezone Europe/Riga” to:
php_value date.timezone Europe/Amsterdam
To find the correct timezone string, you can look here: http://php.net/manual/en/timezones.php
This concludes the command line steps needed for intial setup. Have a look what your IP address is through the ifconfig command, so we can use that in the next part, setting up the frontend.
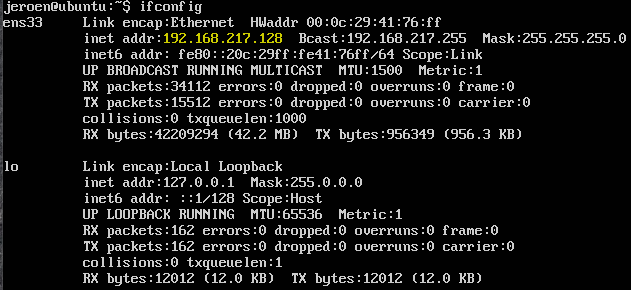
Frontend setup
Open your favorite browser and type the IP address we just found, adding /zabbix
clicking next on the opening screen should show a check of pre-requisites, all in the green:
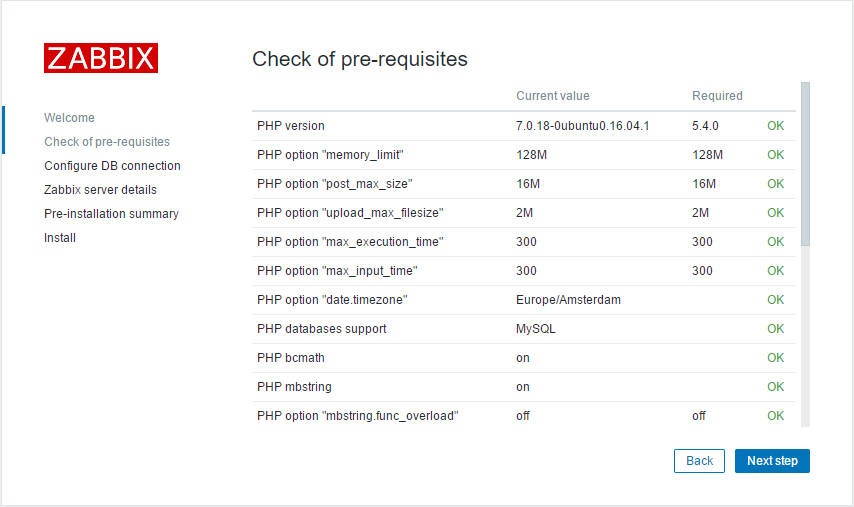
As we have nothing else to do here, go to the next step.
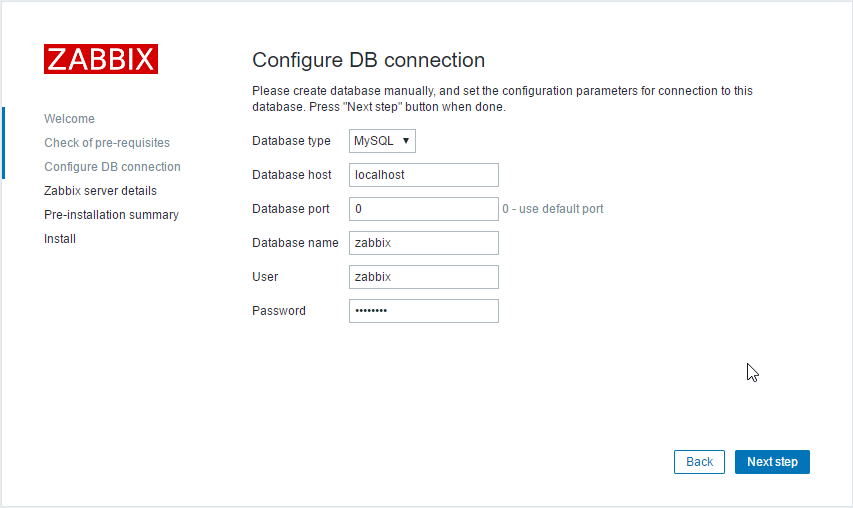
Here we set up the connection between Zabbix & MariaDB. In my case this meant changing the database user name to ‘zabbix’ and the password to ‘password’.
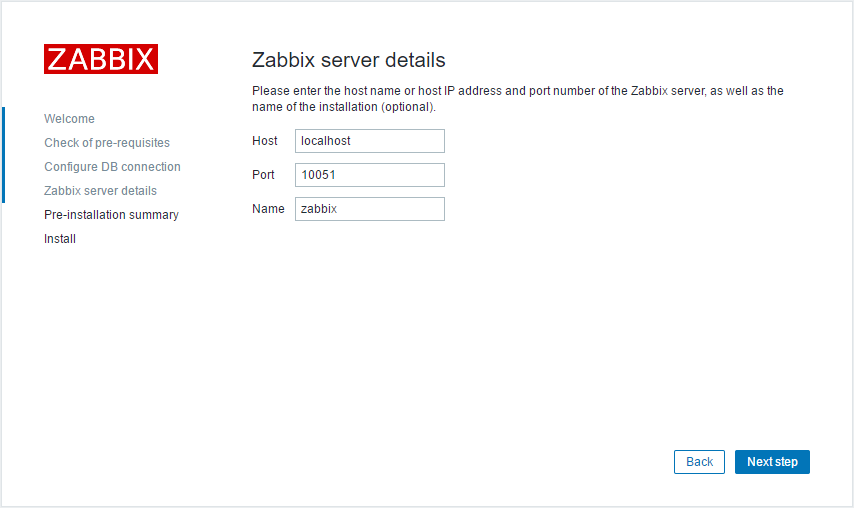
The next screen asks for the server host name, port and Zabbix server name. In my case I only changed the blank Zabbix name to ‘Zabbix’.
After pressing next step you can review a summary of all these settings.
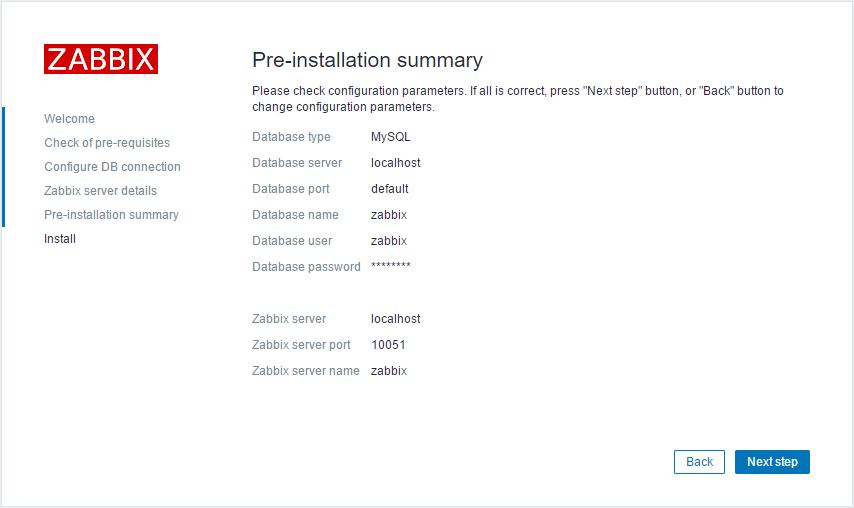
Verify your settings and click next step.
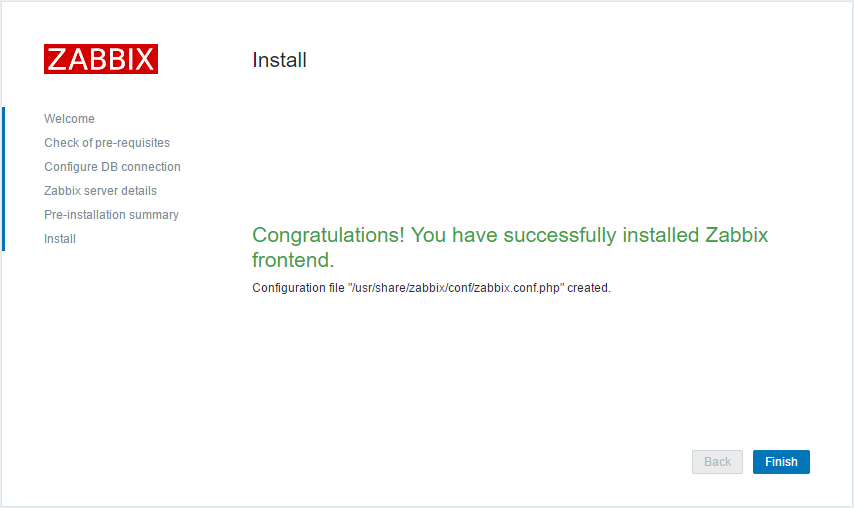
After this we get to the login screen, from which we’ll continue in the installation conclusion.
Installation conclusion
You can now login with name ‘Admin’ and password ‘zabbix’. Beware that’s case sensitive.
Note: at this point I got an error that the server wasn’t started. Examining this with ‘journalctl -xe|less’, apparently my DBName wasn’t filled in. After correcting this and starting the service again it ran fine.
Now that we have a running server, let’s finish up with a few things you might be interested in.
A more secure user setup
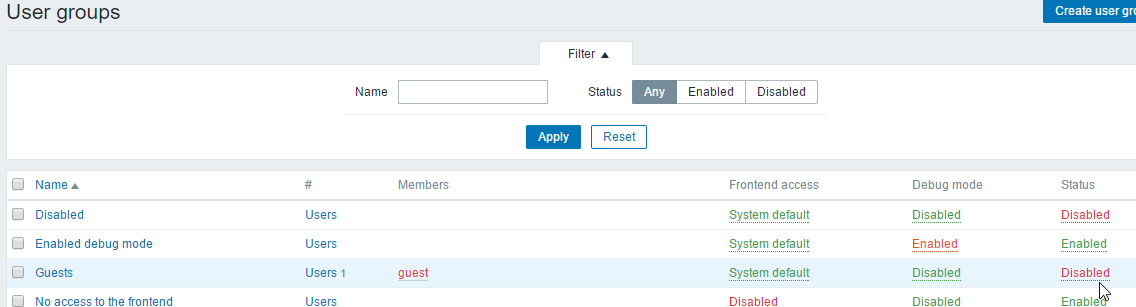
Zabbix has a built in guest account, which can be disabled. We could just delete the user, but in case you might ever want a guest account, disabling is better so it can be easily re-enabled.
Go to Administration/Users groups. On the guests line, click twice on the Status ‘enabled’, till it reads disabled as such:
Now we’re still using Admin/zabbix for our admin user. Easiest way to change this is just edit the current user, so click Admin.
On the Admin user screen, just change the Alias & Password to something else. For example:
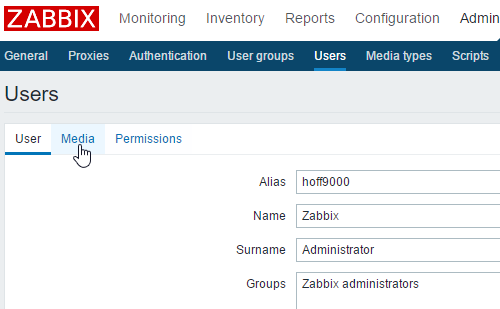
In case you want email alerts this would be the time to fill in an email address on the Media page.
Click add, and then update.
Nothing to look at
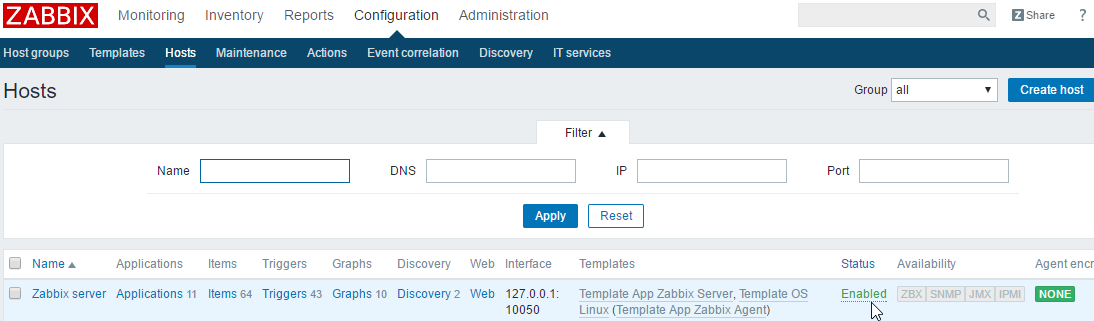
By default, nothing is monitored. To get some monitoring going, go to Configuration/Hosts. Click the status to enable it:
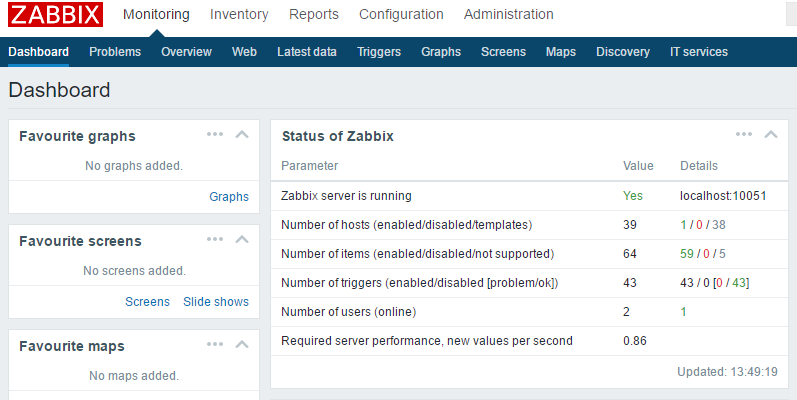
We can verify how much values we are monitoring on the dashboard. Go to Monitoring/Dashboard.
Here we can view the number of hosts, items, triggers, values per second, etc. Note that the Number of hosts value of 39 is a lot higher because it includes templates.
To view some graphs and values, go to Monitoring/Latest Data, and click the hosts Select button and select ‘Zabbix server’, then click Apply.
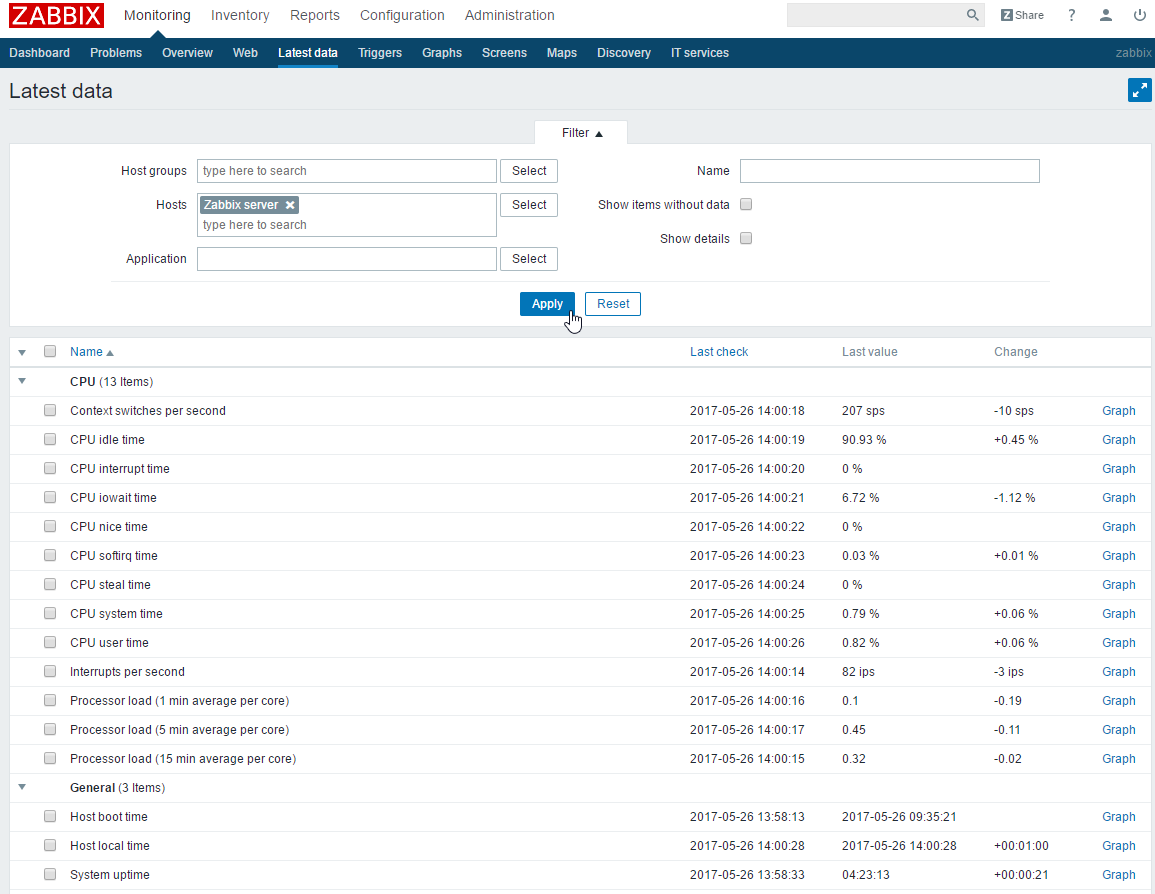
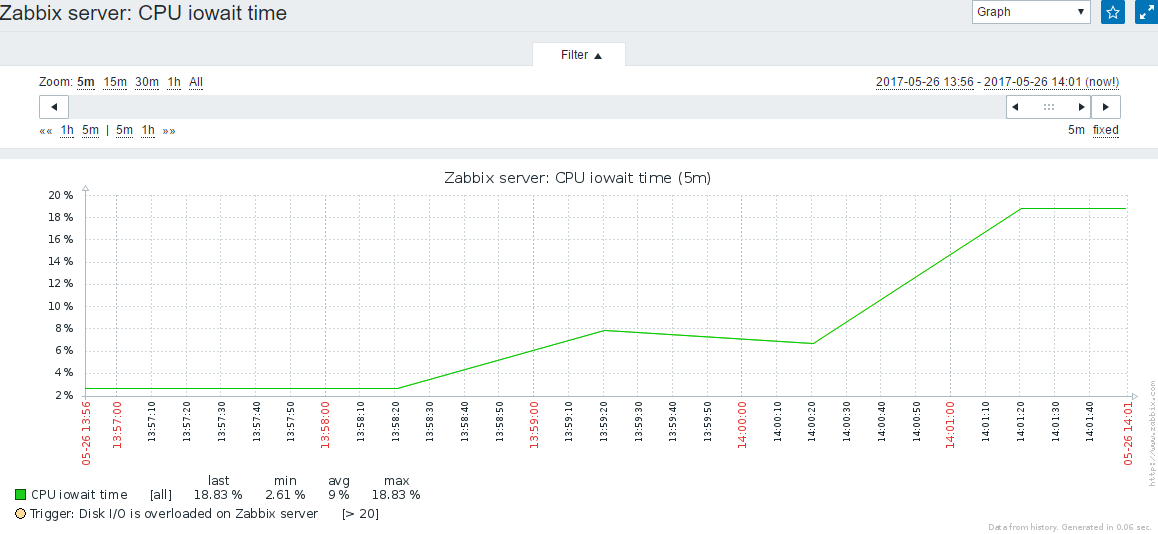
You can click the ‘graph’ buttons on the side to quickly display a graph of that value. Here I took iowait, and changed the zoom to 5 minutes (as this server barely has data yet).
This concludes my first part of setting up a Zabbix server. Next time we’ll continue setting up templates, hosts, alerting, etc..
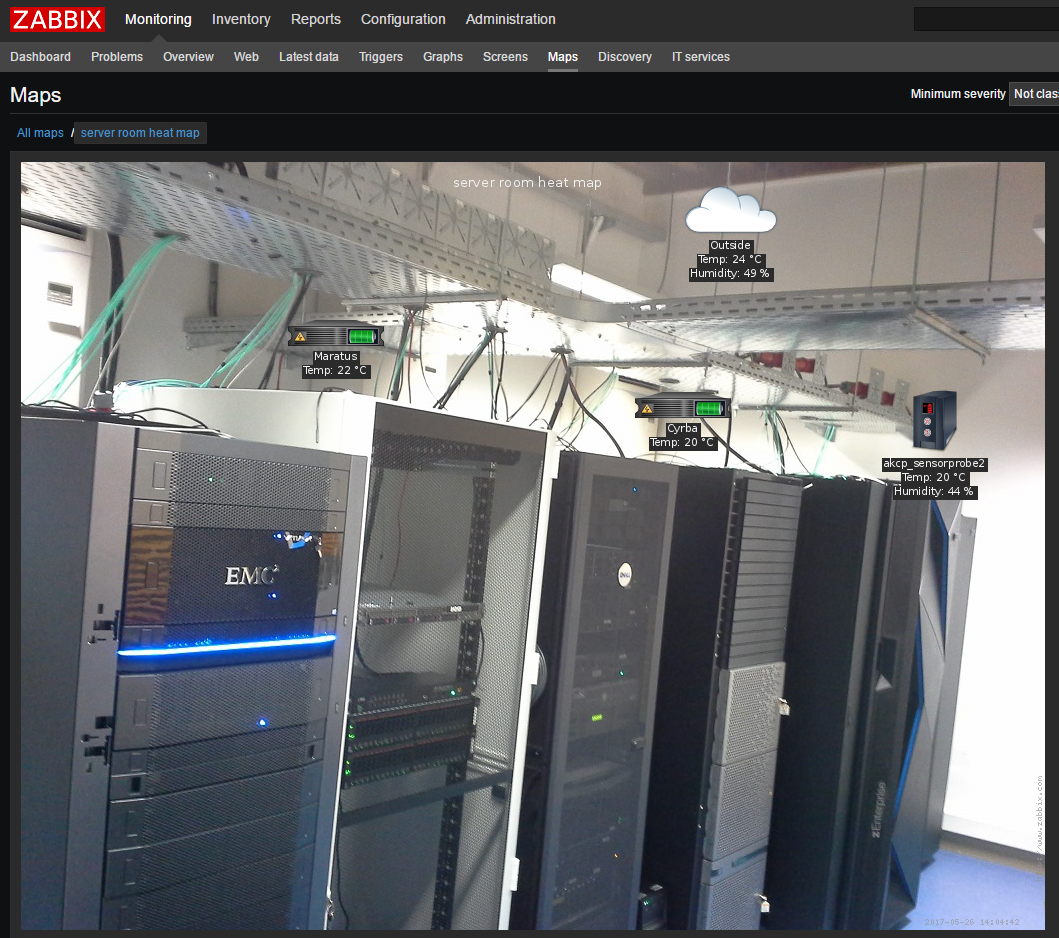
Here’s a screen I made for fun at work that grabs the current Accuweather temperature & humidity, puts it on a photo of the server room, including some readings from a few UPS and a sensorprobe.
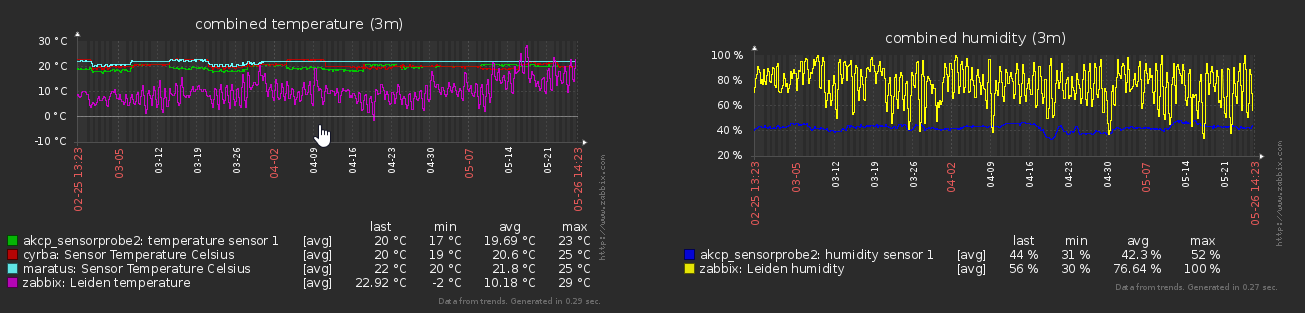
Here’s the graphs over the last 3 months for those values combined. As you can see the temperature was below zero a month ago, while it’s much more comfy now.
to be continued at some point in time 🙂